Keeping modern software systems healthy and performant requires application monitoring. With the increasing complexity of modern applications and the rise of microservices, it has become even more a necessity to have a comprehensive monitoring solution in place. With AWS CloudWatch, you can monitor applications in real-time and diagnose issues before they get worse.
![]()
This blog post will guide you through the process of building a scalable application monitoring system using AWS CloudWatch. You will learn how to leverage CloudWatch Metrics, Alarms, and Terraform to create a robust monitoring solution for your applications. By the end of this post, you will have a solid understanding of how to leverage AWS CloudWatch to build a robust, scalable, and cost-effective application monitoring system for your organization.
What is AWS CloudWatch?
AWS CloudWatch is a monitoring and observability service that provides you with data and actionable insights to monitor your applications, respond to system-wide performance changes, optimize resource utilization, and get a unified view of operational health.
CloudWatch provides a range of monitoring capabilities, including monitoring of EC2 instances, databases, containers, Lambda functions, SQS queues, and more. It allows you to collect and store metrics, logs, and events, and use them to gain insights into the performance and health of your applications.
CloudWatch offers a range of powerful alarm features that enable you to receive notifications when certain metrics exceed predefined thresholds or specific events occur. These notifications can be directed to different targets, including Amazon EC2 instances (which can be stopped, terminated, rebooted, or recovered), trigger Auto Scaling actions, or send notifications to SNS topics, giving you the flexibility to take custom actions in response to different events.
By using CloudWatch for monitoring and alarms, you can proactively detect and respond to issues before they cause disruptions to your applications. This can help to minimize downtime, reduce the risk of data loss, and improve the overall reliability of your systems.
Couple of definitions
Before we dive into the details of building a scalable application monitoring system with AWS CloudWatch, let’s define a few terms that we will be using throughout this post.
Metric
A metric is a variable to monitor, such as the number of requests received by a web server, CPU utilization, the number of database connections, approximate number of messages in SQS queue or the number of errors. Metrics are collected at regular intervals and are represented as time-series data points that consist of a timestamp and a value.
You can also create custom metrics that are specific to your application. For example, you might want to track the number of users who have signed up for your service, the number of items in a shopping cart, or the number of times a specific function is called. Here you can find a solution for creating custom metrics in AWS CloudWatch.
By tracking these metrics over time, you can gain valuable insights into how your system is performing, identify areas for optimization, and ensure that your infrastructure is operating efficiently and effectively.
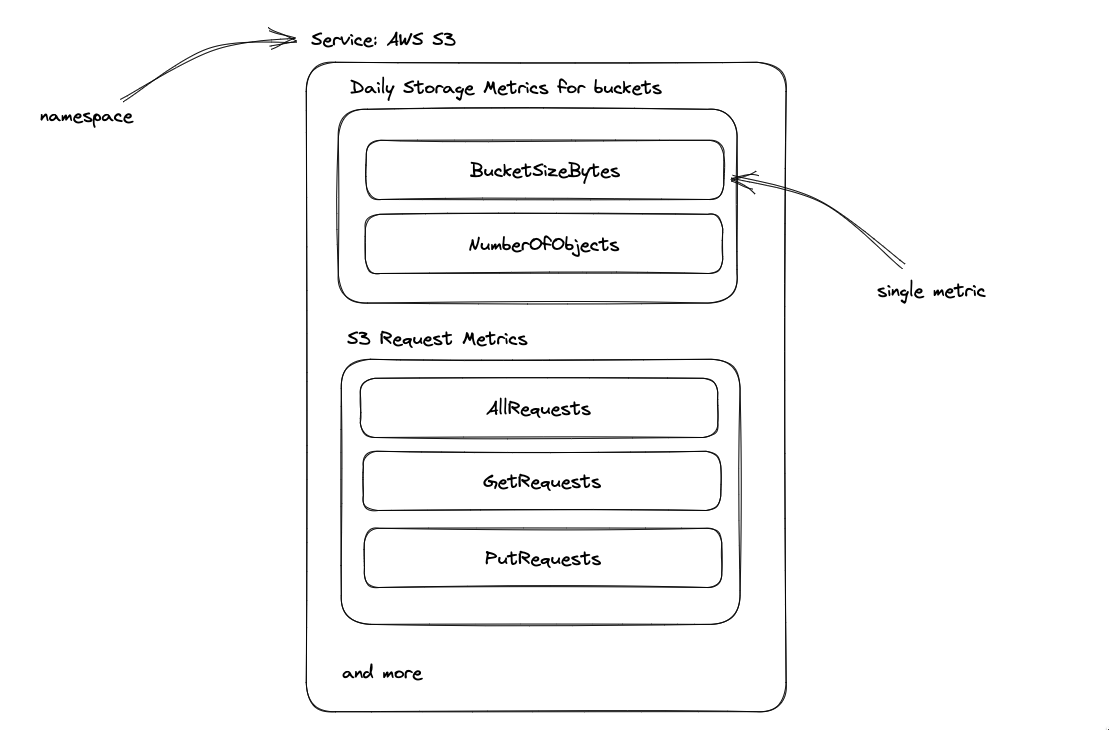 Figure 1: Example of a metrics for AWS S3 service
Metrics can also be built from CloudWatch Logs. For example, you can create a metric that counts the number of log events that match a specific pattern. This can be useful for monitoring the number of errors that occur in your application.
Dimension
Every metric in CloudWatch is accompanied by a set of name/value pairs known as dimensions. These dimensions help provide additional context for the metric being monitored.
For instance, if you are tracking the CPUUtilization metric, you might have a dimension named InstanceId with a corresponding value of i-1234567890abcdef0. Alternatively, you might have a dimension named QueueName with the name of the associated Amazon SQS queue.
By leveraging dimensions, you can more easily monitor and analyze the performance of specific resources or components of your system, gaining valuable insights that help you optimize your infrastructure.
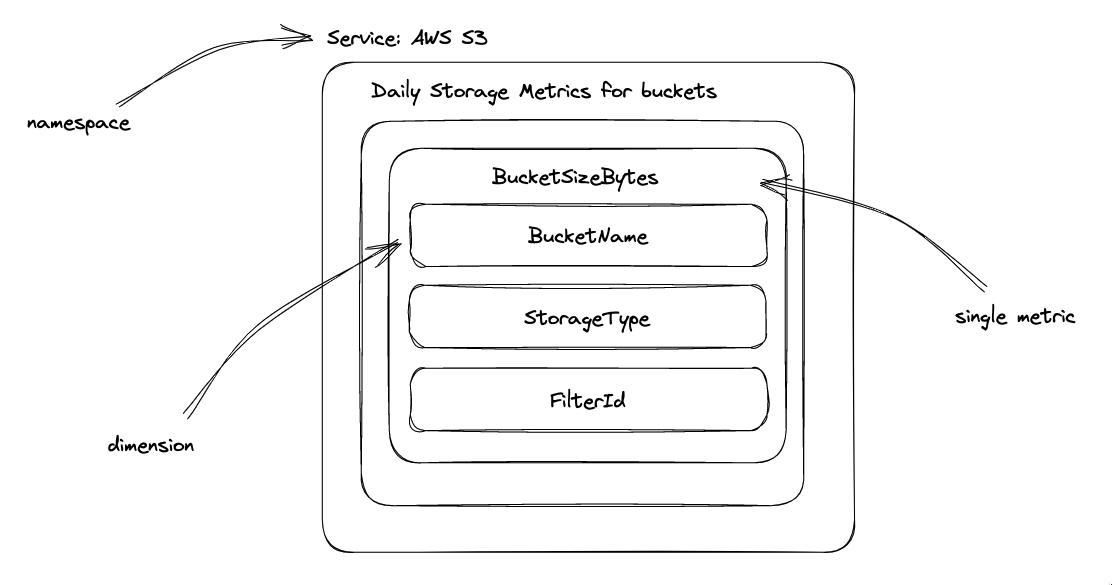 Figure 2: Example of a dimensions for AWS S3 service
You can find a list of dimensions that are associated with each metric in the CloudWatch Metrics Reference.
Alarm
An alarm is a rule that you define in CloudWatch that monitors a single metric or a math expression based on multiple metrics. When the state of the alarm changes, CloudWatch sends a notification to specified targets, such as Amazon EC2 instances, Auto Scaling groups, or SNS topics.
Alarms can be in one of the following states:
OK- The metric is within the specified threshold.ALARM- The metric is outside the specified threshold.INSUFFICIENT_DATA- The alarm has just started, the metric is not available, or CloudWatch has insufficient data to determine the alarm state.
To create a CloudWatch alarm, you define a metric, set a threshold value, and specify one or more actions to be taken when the threshold is breached. You can also specify additional parameters such as the period of time over which to evaluate the metric.
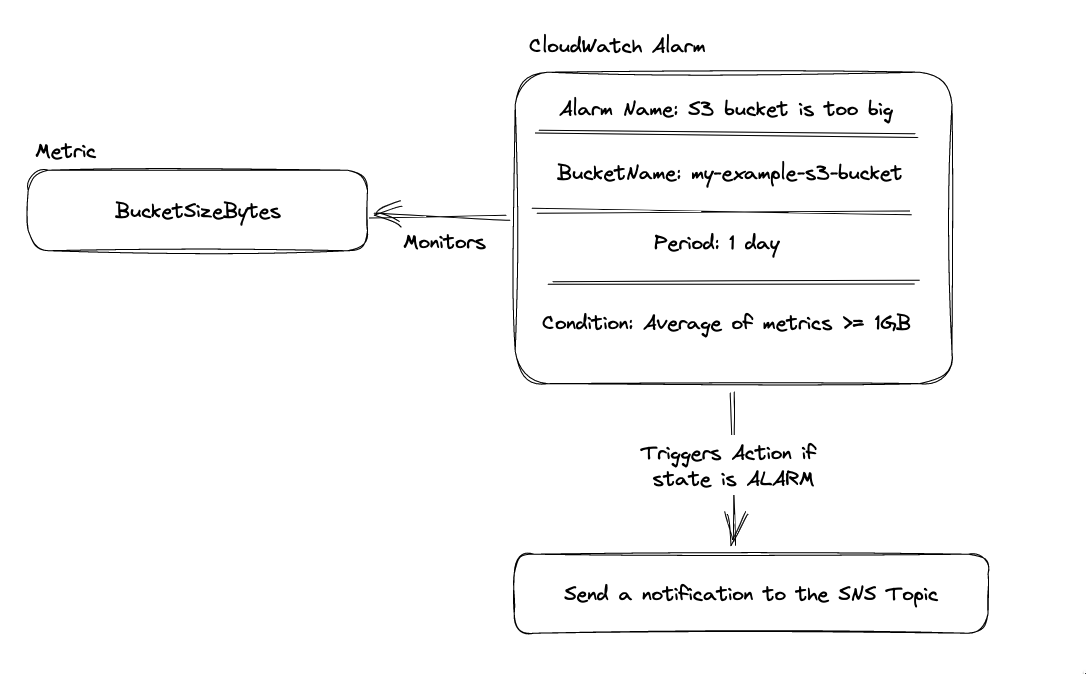 Figure 3: Example of an alarm for AWS S3 service
It is worth noting that CloudWatch alarms are not triggered by a single data point, but rather by a set of data points over a specified period of time. This is known as the evaluation period. For example, if you set the evaluation period to 5 minutes, CloudWatch will evaluate the metric over a period of 5 minutes. If the metric is outside the threshold for the entire period, the alarm will be triggered.
Composite Alarm
A CloudWatch composite alarm is a type of alarm that allows you to create a more complex alarm based on the combination of two or more CloudWatch metrics.
You can define multiple CloudWatch metrics and apply boolean logic (AND or OR) to those metrics to create a composite alarm. This allows you to create more sophisticated alarm conditions that take into account multiple metrics and their relationships. For example, you can create a composite alarm that triggers when both CPU utilization and network traffic exceed certain thresholds at the same time.
Composite alarms can be useful when monitoring complex systems that require more advanced monitoring capabilities. So to reduce “alarm noise” and focus on the most important alarms, you can create composite alarms that combine multiple metrics into a single alarm.
Alarm Target
CloudWatch Alarms allow you to set up notifications when metrics exceed certain thresholds or when specific events occur. These notifications can be sent to various targets, which are the endpoints that receive the alarm notifications.
CloudWatch Alarms targets can include various AWS services, such as Amazon EC2 instances, Amazon SNS topics, Auto Scaling groups, and more. You can also use Amazon SNS to send notifications to email addresses, SMS or invoke Lambda functions.
Building an application monitoring
This section covers the development of a scalable application monitoring system utilizing AWS CloudWatch and Terraform. The monitoring system will consist of three main components: an S3 Bucket, CloudWatch Alarms, and an SNS Topic.
The S3 Bucket will be monitored service, and CloudWatch Alarms will be triggered when the size of the S3 Bucket exceeds a specific threshold. The SNS Topic will be used as a target for these CloudWatch Alarms.
With this monitoring system in place, it will be possible to monitor the size of the S3 Bucket and receive notifications when the size of the bucket surpasses a particular threshold. This system is easily replicable for any other AWS service requiring monitoring.
Furthermore, with notifications sent to the SNS Topic, you can do whatever you want. For instance, you can choose to receive an email, message through Slack, or invoke a Lambda function
Desired architecture can be seen in the Figure 4:
 Figure 4: Desired infrastructure: S3 Bucket, CW Alarm and SNS Topic
Prerequisites
In order to proceed with this demonstration, two prerequisites are required:
- Terraform installed on your machine,
- AWS account.
Before we start, we need to configure Terraform with AWS provider. You can find more information about how to do that in the official Terraform documentation.
After that, we will create a new directory, initialize Terraform, and create a file called providers.tf, which will contain the code needed for this demonstration:
# providers.tf

terraform {
  required_providers {
    aws = {
      source  = "hashicorp/aws"
      version = "~> 4.0"
    }
  }
}

provider "aws" {
  region = var.aws_region
}
After that, we will create a variables.tf file which will contain the variables used in our infrastructure. For now, we will only define the AWS region:
# variables.tf

variable "aws_region" {
  description = "AWS region"
  type        = string
  default     = "eu-west-1"
}
Next, we will define the AWS resources that will be used in this demonstration. We will use the aws_s3_bucket, aws_cloudwatch_metric_alarm, and aws_sns_topic resources to create the S3 Bucket, CloudWatch Alarms, and SNS Topic, respectively.
Defining the S3 Bucket
The first component of our monitoring system will be an S3 Bucket which will be monitored by our system.
We will use the aws_s3_bucket resource to create the S3 Bucket. The code for this resource can be found in the main.tf file:
# main.tf

resource "aws_s3_bucket" "bucket" {
  bucket = "building-scalable-monitoring-system-example"

  tags = {
    Name = "Monitoring"
  }
}
It is worth noting that the bucket name (bucket argument) must be unique across all existing bucket names in Amazon S3. If you are using a bucket name that already exists, you will receive an error.
Create the CloudWatch Alarm
The second component of our monitoring system will be a CloudWatch Alarm. This alarm will be triggered when the size of the S3 Bucket exceeds a specific threshold (defined in variables.tf file):
# main.tf

resource "aws_cloudwatch_metric_alarm" "bucket_is_too_big" {
  alarm_name          = "bucket-is-too-big"
  comparison_operator = "GreaterThanOrEqualToThreshold"
  evaluation_periods  = var.evaluation_periods
  period              = var.period
  threshold           = var.threshold
  namespace           = "AWS/S3"
  statistic           = "Average"
  metric_name         = "BucketSizeBytes"
  treat_missing_data  = "ignore"
  alarm_actions       = [aws_sns_topic.alarm.arn]
  dimensions = {
      BucketName = aws_s3_bucket.bucket.id
  }
}
This CloudWatch Alarm will be triggered when the size of the S3 Bucket exceeds the threshold defined in the threshold variable. The alarm_actions argument specifies the SNS Topic that will be used as a target for this CloudWatch Alarm (we will define this SNS Topic in the next section).
Please note that the alarm notification will be sent only after the number of periods defined in the evaluation_periods variable has passed.
We have to add the following variables to the variables.tf file:
# variables.tf

variable "evaluation_periods" {
  description = "The number of periods over which data is compared to the specified threshold"
  type        = number
  default     = 2
}

variable "period" {
  description = "The period in seconds over which the specified statistic is applied"
  type        = number
  default     = 300
}

variable "threshold" {
  description = "The maximum size of the s3 bucket (in bytes)"
  type        = number
  default     = 100
}
After that we can move forward to the next section and define the SNS Topic and its subscription.
Define the SNS Topic
The third component of our monitoring system will be an SNS Topic. This SNS Topic will be used as a target for the CloudWatch Alarm we defined in the previous section.
First, we will use the aws_sns_topic resource to create the SNS Topic. The code for this resource can be found in the main.tf file:
# main.tf

resource "aws_sns_topic" "alarm" {
  name = "bucket-is-too-big-alarm-topic"
}
We will also define aws_iam_policy_document and aws_iam_policy resources to create the IAM policy that will be used to allow CloudWatch to publish notifications to the SNS Topic:
# main.tf

data "aws_iam_policy_document" "alarm_sns_topic_policy" {
  statement {
    actions = ["SNS:Publish"]
    effect  = "Allow"
    principals {
      type        = "AWS"
      identifiers = ["*"]
    }
    resources = [aws_sns_topic.alarm.arn]
    condition {
      test     = "ArnEquals"
      variable = "aws:SourceArn"
      values   = [aws_cloudwatch_metric_alarm.bucket_is_too_big.arn]
    }
  }
}

resource "aws_sns_topic_policy" "alarm_sns_topic_policy" {
  arn = aws_sns_topic.alarm.arn
  policy = data.aws_iam_policy_document.alarm_sns_topic_policy.json
}
The last thing we need to do is to define the subscription for the SNS Topic to send notifications to the email address we specify. We will use the aws_sns_topic_subscription resource to create the subscription:
# main.tf

resource "aws_sns_topic_subscription" "email" {
  endpoint  = var.email
  protocol  = "email"
  topic_arn = aws_sns_topic.alarm.arn
}
We have to add the following variable to the variables.tf file:
# variables.tf

variable "email" {
  description = "Email address to send alerts to"
  type        = string
}
At the end we can also add the following output to the outputs.tf file:
# outputs.tf

output "alarm_name" {
  value = aws_cloudwatch_metric_alarm.bucket_is_too_big.alarm_name
}

output "s3_object_uri" {
  value = "s3://${aws_s3_bucket.bucket.bucket}/"
}
Now, we can run terraform init and terraform apply to create the resources. The terraform will ask you to enter the email address to send alerts to.
After that, you will receive an email with the confirmation code. You have to enter this code to confirm the subscription.
Testing the Monitoring System
Before we test the monitoring system end-to-end, we will use AWS CLI (set-alarm-state) to trigger the CloudWatch Alarm we created:
aws cloudwatch set-alarm-state --alarm-name "bucket-is-too-big" --state-value ALARM --state-reason "testing purposes"
In the command above, you can use the value the --alarm-name argument from the alarm_name terraform output.
If everything is configured correctly, you will receive an email with the alarm message!
Now, we will use the AWS CLI to upload a file to the S3 Bucket we created:
aws s3 cp <path to file in your local machine> s3://building-scalable-monitoring-system-example/
Regrettably, you will not receive an immediate threshold notification as the metric used in this case (BucketSizeBytes) is calculated on a daily basis. This implies that its data is updated in CloudWatch once every 24 hours.
As a result, it may take up to 24 hours to obtain a notification once the threshold is reached. However, you can still check the metric values in CloudWatch to monitor the metric’s performance and see if it reaches the threshold. Additionally, you may want to consider using a metric that is updated more frequently if you require a quicker response time for your threshold notifications.
You can create other metrics sources (for example SQS queue) and create a CloudWatch Alarm to monitor the metric in-real time.
All necessary code for this article can be found in my repository.
Conclusion
In conclusion, AWS CloudWatch is a powerful monitoring and observability service that provides data and actionable insights to monitor and respond to changes in the performance of applications, optimize resource utilization, and get a unified view of operational health.
With CloudWatch Metrics and Alarms, you can collect and store metrics, create custom metrics, and monitor different services such as EC2 instances, databases, containers, Lambda functions, SQS queues, and more.
You can use CloudWatch to proactively detect and respond to issues before they cause disruptions to your applications, minimize downtime, reduce the risk of data loss, and improve the overall reliability of your systems.
By following the guide in this blog post, you can leverage CloudWatch to build a robust, scalable, and cost-effective application monitoring system for your organization.